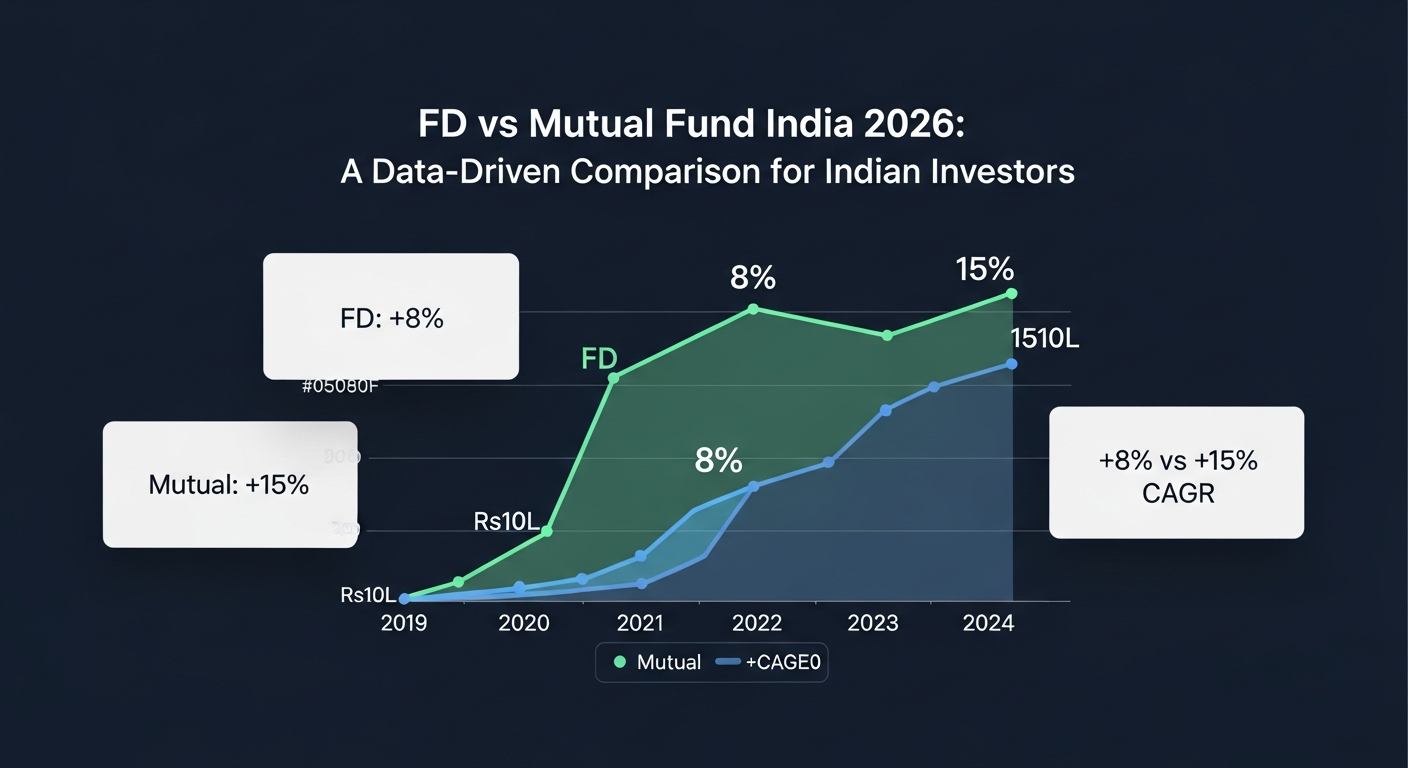
What Is the Fundamental Difference Between FD and Mutual Fund in India?
The fundamental difference between Fixed Deposits (FDs) and Mutual Funds in India lies in their underlying structure, risk-return profile, and regulatory oversight. FDs are debt instruments offering fixed, guaranteed returns and capital protection, primarily regulated by the Reserve Bank of India (RBI) and insured by DICGC. Mutual funds, conversely, are market-linked investment vehicles managed by professional fund managers, regulated by the Securities and Exchange Board of India (SEBI), and offer variable returns with exposure to market risks.
How do Fixed Deposits work in India?
Fixed Deposits involve depositing a lump sum of money with a bank or non-banking financial company (NBFC) for a pre-determined period at a fixed interest rate. The interest is compounded periodically (monthly, quarterly, or annually) and paid out at maturity or at regular intervals. The principal amount is protected, and deposits up to Rs 5 lakh per bank per depositor are insured by the Deposit Insurance and Credit Guarantee Corporation (DICGC), an RBI subsidiary, as per current regulations.
How do Mutual Funds work in India?
Mutual funds pool money from multiple investors to invest in a diversified portfolio of stocks, bonds, or other securities, managed by an Asset Management Company (AMC). Investors purchase units, and the value of these units, known as the Net Asset Value (NAV), fluctuates with the market performance of the underlying assets. Returns are not guaranteed, but mutual funds offer professional management, diversification, and potential for higher, inflation-adjusted growth.
How Do Fixed Deposits and Mutual Funds Generate Returns and Manage Risk?
Fixed Deposits generate returns through pre-determined interest rates, offering predictable income and minimal capital risk. Mutual funds, however, generate returns from capital appreciation, dividends, or interest payments from their underlying investments, with risk managed through diversification and professional fund management, but always subject to market volatility.
What are the primary sources of returns for each investment?
Fixed Deposits primarily generate returns from the fixed interest rate agreed upon at the time of deposit. This rate remains constant throughout the tenure, providing predictable income. Mutual funds generate returns through various avenues: capital gains from the sale of appreciated securities, dividends from stocks, and interest from bonds. The specific source depends on the fund's investment objective and portfolio composition.
How is risk managed in Fixed Deposits versus Mutual Funds?
Risk in Fixed Deposits is managed by the bank's solvency and the DICGC insurance cover of up to Rs 5 lakh per depositor per bank, guaranteeing the principal and accrued interest up to that limit. Mutual funds manage risk through diversification across various asset classes, sectors, and companies. However, they are inherently subject to market risks, and capital is not guaranteed. Fund managers employ strategies like asset allocation and security selection to mitigate, but not eliminate, these risks.
Comparing FD vs Mutual Fund: A Structural Analysis (2026)
A comprehensive structural analysis of FDs and mutual funds for 2026 highlights their distinct characteristics across key parameters like returns, risk, liquidity, and taxation. Understanding these differences is crucial for aligning investment choices with individual financial goals and risk tolerance.
| Parameter | Fixed Deposit (FD) | Mutual Fund |
|---|---|---|
| Regulatory Body | Reserve Bank of India (RBI) | Securities and Exchange Board of India (SEBI) |
| Risk Profile | Low risk (capital protection up to ₹5 Lakh by DICGC) | Variable risk (market-linked; equity funds are high risk, debt funds are moderate risk) |
| Return Nature | Fixed, guaranteed interest rate (e.g., 6-8% p.a. as of mid-2026) | Market-linked, variable (potential for 10-15%+ CAGR for equity over long term) |
| Liquidity | Moderate (premature withdrawal possible with penalty) | High (open-ended funds can be redeemed typically in 2-3 business days, subject to exit loads) |
| Taxation (as of FY2026-27) | Interest taxed at income tax slab rate annually | Equity LTCG (over ₹1 lakh): 10%; STCG: 15%. Debt (post Apr 2023): taxed at slab rate |
| Inflation Hedge | Poor (returns often lag inflation in the long run) | Good (equity funds aim to beat inflation over long periods) |
| Investment Horizon | Short to Medium Term (1-5 years) | Medium to Long Term (3+ years for debt, 5+ years for equity) |
| Investment Amount | Lump sum (minimums vary by bank) | Lump sum or Systematic Investment Plan (SIP) from ₹100 |
| Professional Management | Not applicable (self-managed) | Yes, by fund managers and research teams |
Quantifying the Impact: FD vs Mutual Fund Corpus Projections
To truly understand the long-term implications of choosing between FDs and mutual funds, it's essential to quantify the potential corpus accumulation with realistic return assumptions and account for factors like Total Expense Ratio (TER) in mutual funds. This section provides worked examples for a clearer perspective on wealth creation over time.
What is the long-term corpus difference with a lump sum investment?
Let's project the growth of an initial lump sum investment of Rs 5,00,000 over 15 years, comparing a Fixed Deposit with an equity mutual fund. For the FD, we assume a consistent 7.25% annual interest rate. For the mutual fund, we'll use an illustrative gross CAGR of 13% (before expenses) for a diversified equity fund like Parag Parikh Flexi Cap Fund (Direct Plan Growth), and apply a Total Expense Ratio (TER) of 0.70% for its Direct Plan.
Scenario 1: Fixed Deposit
- Starting Corpus: Rs 5,00,000
- Annual Interest Rate: 7.25%
- Investment Period: 15 years
- Final Corpus (pre-tax): Rs 5,00,000 * (1 + 0.0725)^15 = Rs 14,75,463
Scenario 2: Equity Mutual Fund (Illustrative: Parag Parikh Flexi Cap Fund - Direct Plan Growth)
- Starting Corpus: Rs 5,00,000
- Gross CAGR: 13.00%
- Direct Plan TER: 0.70% (as of FY2026-27, within SEBI limits per SEBI/HO/IMD/DF2/CIR/P/2019/14 dated January 22, 2019)
- Net CAGR (13.00% - 0.70%): 12.30%
- Investment Period: 15 years
- Final Corpus (pre-tax): Rs 5,00,000 * (1 + 0.1230)^15 = Rs 29,48,220
This example demonstrates that while FDs offer certainty, the potential for wealth creation through equity mutual funds over a 15-year horizon can be substantially higher, even after accounting for the TER. The difference in final corpus is Rs 14,72,757 (Rs 29,48,220 - Rs 14,75,463).
Free · No spam · Unsubscribe anytime
Learn investing without the jargon
Plain-English guides on MFs, SIPs, and taxes — one email a week, free forever.
What is the impact of TER on a Systematic Investment Plan (SIP)?
Let's consider a Systematic Investment Plan (SIP) of Rs 10,000 per month over 20 years. We will compare a Fixed Deposit (if a recurring deposit offered similar rates) and an equity mutual fund, specifically Mirae Asset Large Cap Fund (Direct Plan Growth) for illustrative purposes. For the FD/RD, we assume a 7.00% annual rate. For the mutual fund, a gross CAGR of 12.50% and a Direct Plan TER of 0.65%.
Scenario 1: Recurring Deposit (RD) / FD-like returns
- Monthly SIP: Rs 10,000
- Annual Rate: 7.00%
- Investment Period: 20 years (240 months)
- Total Invested: Rs 10,000 * 240 = Rs 24,00,000
- Estimated Final Corpus (pre-tax): Approximately Rs 52,40,000
Scenario 2: Equity Mutual Fund (Illustrative: Mirae Asset Large Cap Fund - Direct Plan Growth)
- Monthly SIP: Rs 10,000
- Gross CAGR: 12.50%
- Direct Plan TER: 0.65% (as of FY2026-27)
- Net CAGR (12.50% - 0.65%): 11.85%
- Investment Period: 20 years (240 months)
- Total Invested: Rs 24,00,000
- Estimated Final Corpus (pre-tax): Approximately Rs 97,50,000
This SIP example vividly illustrates the power of compounding and market-linked returns. Over 20 years, the mutual fund could potentially generate a corpus almost double that of the RD, even after accounting for the expense ratio. The difference is approximately Rs 45,10,000 (Rs 97,50,000 - Rs 52,40,000).
Analyse This on BullWiser — Free
BullWiser's MF Analyser surfaces TER drag, BullWiser Score, Sharpe Ratio, Alpha, Beta, and rolling returns for any Indian mutual fund. Compare funds side by side or upload your CAS statement to diagnose your full portfolio's weighted expense load and overlap.
Open BullWiser MF Analyser →Common Misconceptions About FD vs Mutual Fund
Many investors hold simplified views about FDs and mutual funds, often leading to suboptimal investment decisions. It's crucial to address these common misconceptions with data-backed insights to enable more informed financial planning.
Is it true that FDs are always 100% safe and risk-free?
While FDs are considered low-risk, they are not entirely risk-free. The primary risk is inflation risk, where the fixed interest rate may not keep pace with the rising cost of living, eroding the purchasing power of your money over time. Additionally, while the DICGC insures deposits, it's only up to Rs 5 lakh per bank per depositor, meaning amounts above this limit are exposed to bank default risk, though such occurrences are rare in scheduled commercial banks. Thus, FDs offer capital safety but not immunity from all financial risks.
Do mutual funds only offer high returns for high risk?
This is a common oversimplification. Mutual funds offer a spectrum of risk and return profiles, not just high risk for high returns. While equity-oriented funds (like small-cap funds) inherently carry higher risk and potential for higher returns, there are also debt funds, hybrid funds, and even conservative equity funds that target more moderate risk-return profiles. The risk level depends entirely on the underlying assets and the fund's investment strategy, allowing investors to choose a fund suitable for their risk tolerance, which can be assessed using metrics like standard deviation, Beta, and Sharpe Ratio.
Is investing in multiple FDs better than one mutual fund?
Investing in multiple FDs can provide diversification across banks and tenures, mitigating single-bank risk and managing liquidity. However, it does not offer the same level of diversification as a single well-managed equity or hybrid mutual fund, which typically holds dozens, if not hundreds, of different securities across various sectors. A single mutual fund offers inherent diversification across market instruments and professional management, which multiple FDs cannot replicate in terms of market exposure and growth potential. This is especially true when considering the potential for inflation-adjusted returns, which FDs generally struggle to provide.
Frequently Asked Questions About FD vs Mutual Fund
Which is better for long-term wealth creation: FD or mutual fund?
For long-term wealth creation, mutual funds, particularly equity-oriented ones, generally offer higher potential returns that can outpace inflation. This is due to their market-linked nature and compounding growth over extended periods. Fixed deposits are typically better suited for short-to-medium term capital preservation.
What are the tax implications of FDs versus mutual funds in India?
FD interest is taxed annually at your income tax slab rate. Equity mutual fund long-term capital gains (LTCG) exceeding Rs 1 lakh in a financial year are taxed at 10% without indexation, while short-term capital gains (STCG) are taxed at 15%. Debt mutual funds purchased after April 2023 are taxed at your income tax slab rate. Understanding these differences is crucial for tax planning.
How do risk levels compare between fixed deposits and mutual funds?
Fixed deposits are considered low-risk as they offer guaranteed returns and deposit insurance up to Rs 5 lakh per bank per depositor by DICGC. Mutual funds, especially equity funds, carry higher market risk, meaning their value can fluctuate based on market performance. Your capital is not guaranteed in mutual funds.
Can I invest in FDs and mutual funds simultaneously?
Yes, it is common and often recommended to invest in both FDs and mutual funds. This strategy, known as asset allocation, helps balance capital safety with growth potential. Many investors use FDs for emergency funds or short-term goals, and mutual funds for long-term wealth creation.
What is the typical return difference between FDs and mutual funds?
As of mid-2026, FDs typically offer annual returns in the range of 6-8%, depending on tenure and bank. Equity mutual funds, over a 5-10 year horizon, have historically delivered 10-15% or more, though these are market-linked and not guaranteed. The potential for higher returns with mutual funds comes with higher risk.
Are fixed deposits or mutual funds more liquid?
Open-ended mutual funds are generally more liquid, allowing redemption typically within 2-3 business days, though exit loads may apply for early withdrawals. FDs can be prematurely broken, but often incur a penalty, reducing the effective interest rate. This makes mutual funds more accessible for urgent needs.
Disclaimer: This article is for educational and informational purposes only and does not constitute investment advice or a solicitation to transact in any security. Mutual fund investments are subject to market risks. Past performance is not indicative of future returns. All regulatory data referenced is subject to change — verify current SEBI and AMFI guidelines on official sources. Consult a SEBI-registered investment adviser before making any financial decision.
For a complete list of SEBI-registered investment advisers, visit the official SEBI portal: SEBI Registered Investment Advisers.