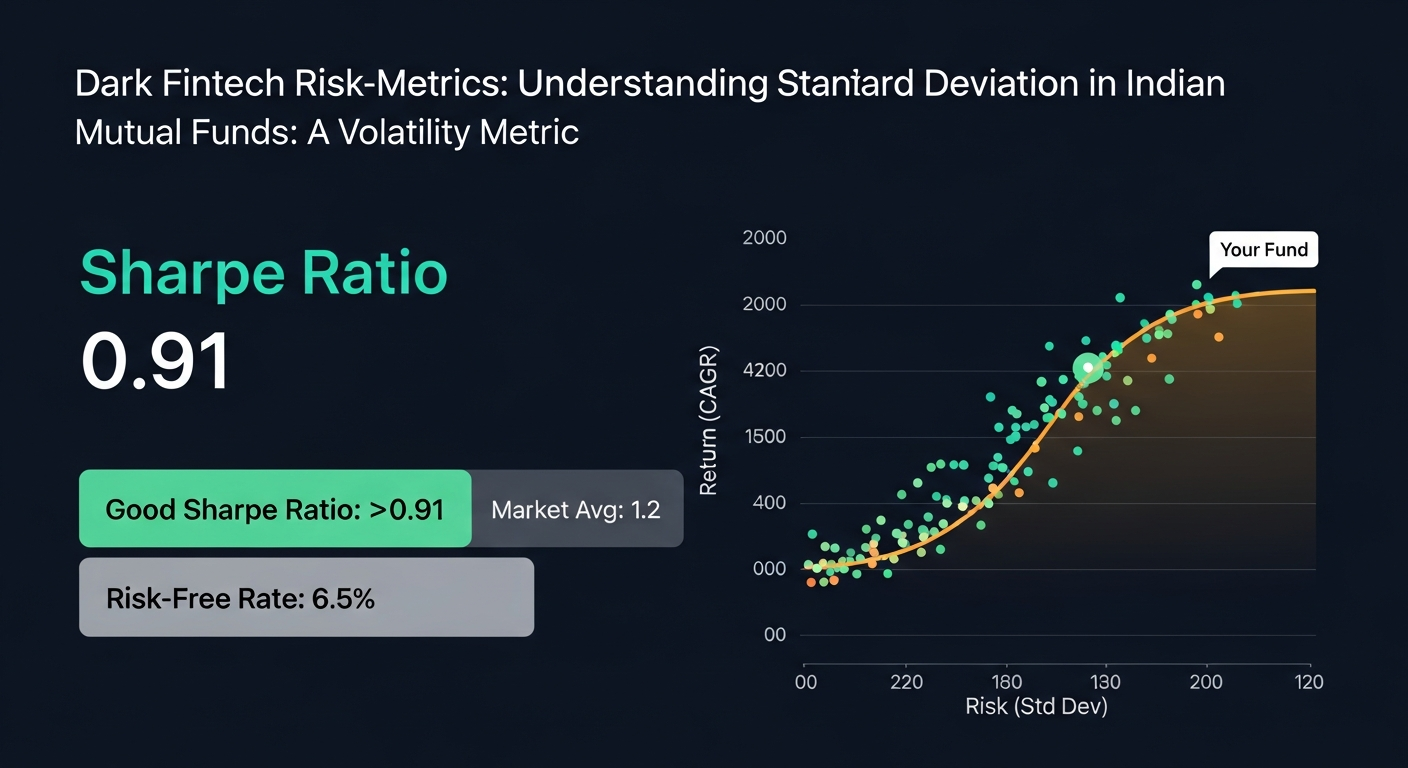
What Is Standard Deviation in Mutual Funds India?
Standard deviation in mutual funds is a statistical measure that quantifies the historical volatility or dispersion of a fund's returns around its average return. It indicates the degree to which a fund's performance has fluctuated over a given period. For Indian investors, understanding this metric is crucial for assessing the inherent risk profile of a mutual fund, as it directly relates to the predictability and stability of returns.
A fund with a higher standard deviation implies that its returns have historically been more volatile, experiencing wider swings both up and down. Conversely, a lower standard deviation suggests that the fund's returns have been more consistent and closer to its average performance. This metric is a cornerstone of risk analysis in portfolio management, providing an empirical basis for evaluating a fund's risk-return trade-off.
What is a good standard deviation for a mutual fund?
There isn't a universally 'good' standard deviation value for a mutual fund; its interpretation is highly contextual. A fund's standard deviation should always be evaluated relative to its peer group within the same SEBI-defined category, its benchmark index, and the investor's individual risk tolerance. For instance, a small cap fund will inherently have a higher standard deviation than a large cap fund due to the nature of the underlying assets, as defined by SEBI's categorisation circular SEBI/HO/IMD/DF3/CIR/P/2017/114 dated October 6, 2017.
How does standard deviation differ from beta in mutual funds?
Standard deviation measures a fund's total volatility, encompassing both market-related and fund-specific risks, regardless of the market's direction. In contrast, Beta specifically measures a fund's volatility relative to its benchmark index, indicating its sensitivity to broader market movements. A Beta of 1 means the fund moves in line with the market, while a Beta greater than 1 suggests higher sensitivity. While standard deviation captures absolute fluctuations, Beta focuses on systematic risk relative to the market.
Why is a lower standard deviation generally preferred?
A lower standard deviation is generally preferred by risk-averse investors because it indicates more stable and predictable returns. Funds with lower volatility tend to experience less severe drawdowns during market corrections, offering a smoother investment journey. This consistency can be particularly appealing for investors with shorter investment horizons or those who prioritise capital preservation over aggressive growth, although it often comes with the trade-off of potentially lower average returns compared to higher-volatility peers.
How Is Standard Deviation Calculated and What Does It Signify?
Standard deviation is calculated by taking the square root of the variance of a fund's returns. This involves determining the average (mean) return, calculating the difference between each period's return and the mean, squaring those differences, averaging the squared differences (variance), and finally taking the square root. While the exact mathematical formula is complex, its significance lies in quantifying the historical range within which a fund's returns have typically fallen around its average.
The resulting number indicates the typical deviation from the fund's average return. For example, if a fund has an average annual return of 12% and a standard deviation of 10%, it suggests that in approximately 68% of the cases, its annual returns have ranged between 2% (12%-10%) and 22% (12%+10%). This range helps investors understand the potential variability and risk associated with the fund's performance over time, offering a probabilistic view of its future return trajectory based on historical data.
What factors influence a mutual fund's standard deviation?
Several factors influence a mutual fund's standard deviation, primarily the asset classes it invests in, its portfolio concentration, and its investment strategy. Equity funds, especially small cap funds, typically exhibit higher standard deviations due to greater stock price volatility, as small companies are more sensitive to market changes. Conversely, debt funds generally have lower standard deviations because fixed-income instruments are less volatile. A fund manager's active trading strategy or significant sector bets can also increase a fund's volatility.
Does the investment horizon impact the relevance of standard deviation?
The investment horizon significantly impacts the relevance of standard deviation. For short-term investors, a high standard deviation indicates a greater likelihood of substantial fluctuations, making the timing of entry and exit critical. However, for long-term investors (e.g., 10+ years), short-term volatility tends to smooth out, and the focus shifts more towards the fund's overall average return and risk-adjusted performance. Over extended periods, the impact of individual volatile years lessens as compounding takes effect, making long-term CAGR more prominent.
Comparing Standard Deviation Across Fund Categories
Standard deviation varies significantly across different mutual fund categories, reflecting the inherent risk profiles of the underlying asset classes and investment mandates. Equity-oriented funds, particularly those investing in smaller market capitalisation companies, typically exhibit higher standard deviations compared to debt funds or hybrid funds. This difference is a direct consequence of the volatility associated with equity markets versus the relatively stable returns of fixed-income securities.
Understanding these category-specific ranges is crucial when evaluating a fund's standard deviation. A value that might be considered high for a large-cap fund could be perfectly normal for a small-cap fund. The SEBI categorisation circular SEBI/HO/IMD/DF3/CIR/P/2017/114 dated October 6, 2017, defines these categories, guiding investors on what to expect in terms of risk and return characteristics for each.
| Fund Category | Typical Standard Deviation Range (Illustrative, Annualised) | Underlying Asset Volatility |
|---|---|---|
| Large Cap Equity Fund | 12% - 18% | Moderate |
| Flexi Cap Equity Fund | 15% - 22% | Moderate to High |
| Small Cap Equity Fund | 18% - 28% | High |
| Aggressive Hybrid Fund | 10% - 16% | Moderate |
| Corporate Bond Fund | 2% - 5% | Low |
| Liquid Fund | 0.5% - 1.5% | Very Low |
Does standard deviation vary by fund category?
Yes, standard deviation varies significantly by fund category due to the differing risk characteristics of their underlying investments. Equity funds, especially those focused on mid and small-cap segments like the SBI Small Cap Fund, typically have higher standard deviations than large-cap funds like Mirae Asset Large Cap Fund. Debt funds, such as HDFC Liquid Fund, exhibit the lowest standard deviations, reflecting their stable fixed-income portfolios. This variation is a natural outcome of market dynamics and asset class behaviour.
How do I use standard deviation to compare two funds?
To use standard deviation effectively when comparing two funds, ensure they belong to the same SEBI-defined category and have similar investment objectives and benchmarks. A lower standard deviation generally indicates a more consistent performer within that category. However, always consider it alongside returns: a fund with slightly higher standard deviation but significantly higher returns might offer better risk-adjusted performance, which you can further assess using metrics like the Sharpe Ratio.
Impact of Standard Deviation on a Rs 10 Lakh Corpus: A Worked Example
Understanding standard deviation goes beyond theoretical definitions; its real impact surfaces when considering the actual growth and potential fluctuations of your investment corpus. A fund's volatility directly affects the range of possible outcomes for your investment over time, even if the average return remains the same. This example illustrates how two funds with identical average returns but differing standard deviations can lead to vastly different investment experiences and final corpus values.
Free · No spam · Unsubscribe anytime
Learn investing without the jargon
Plain-English guides on MFs, SIPs, and taxes — one email a week, free forever.
How does standard deviation affect my long-term portfolio growth?
Standard deviation significantly affects your long-term portfolio growth by dictating the consistency of returns and the depth of potential drawdowns. While a higher standard deviation fund might offer higher average returns, it also exposes your corpus to greater downside risk during market downturns, potentially requiring more time to recover. Conversely, a lower standard deviation fund provides a smoother growth trajectory, reducing the emotional impact of volatility and offering more predictable compounding, which is crucial for goals linked to a specific timeline.
Worked Example: Rs 10 Lakh Corpus Over 5 Years
Let's consider an initial investment of Rs 10,00,000 in two hypothetical equity funds, Fund X and Fund Y, both targeting an average annual return of 12% before expenses, over a 5-year period. However, they differ significantly in their standard deviation.
- Fund X: Average Annual Return = 12%, Standard Deviation = 10%
- Fund Y: Average Annual Return = 12%, Standard Deviation = 20%
We'll also factor in a Total Expense Ratio (TER) to show the net impact. For illustrative purposes, let's assume Fund X (lower volatility) has a Direct Plan TER of 0.80% and Fund Y (higher volatility) has a Direct Plan TER of 1.20% (both within SEBI's equity TER cap of 2.25% as of FY2024-25).
| Metric | Fund X (Lower Volatility) | Fund Y (Higher Volatility) |
|---|---|---|
| Initial Corpus | ₹10,00,000 | ₹10,00,000 |
| Assumed Gross CAGR | 12.00% | 12.00% |
| Direct Plan TER (Annual) | 0.80% | 1.20% |
| Net CAGR (Gross - TER) | 11.20% | 10.80% |
| Standard Deviation | 10% | 20% |
| Projected Corpus After 5 Years (Net CAGR) | ₹16,98,900 | ₹16,73,800 |
| Potential Range of Corpus (1 Std Dev from Average)* | ₹15,03,000 to ₹19,13,000 | ₹13,87,000 to ₹20,20,000 |
*Note: The potential range is illustrative, showing where 68% of annual returns would fall, thus impacting the final corpus. It's not a guarantee but a probability based on historical volatility.
Analysis: Although both funds aim for a 12% gross return, Fund X, with its lower standard deviation and lower TER, offers a more predictable growth path and a slightly higher projected net corpus due to less expense drag. More importantly, the *range of outcomes* for Fund X (₹15.03 Lakh to ₹19.13 Lakh) is significantly tighter than for Fund Y (₹13.87 Lakh to ₹20.20 Lakh). This means an investor in Fund Y faces a much wider swing in potential final value, with a higher probability of experiencing returns significantly below the average, or significantly above. For an investor requiring a more consistent outcome, Fund X presents a less volatile and thus less stressful journey.
Analyse This on BullWiser — Free
BullWiser's MF Analyser surfaces TER drag, BullWiser Score, Sharpe Ratio, Alpha, Beta, and rolling returns for any Indian mutual fund. Compare funds side by side or upload your CAS statement to diagnose your full portfolio's weighted expense load and overlap.
Open BullWiser MF Analyser →Common Misconceptions About Standard Deviation in Mutual Funds
Despite its importance, standard deviation is often misunderstood or misinterpreted by investors, leading to suboptimal decision-making. It's crucial to debunk these common myths to ensure a more informed approach to mutual fund selection and risk management. Standard deviation is a historical measure and should always be viewed in context with other metrics and an investor's goals.
Is a high standard deviation always bad for my investments?
A high standard deviation is not inherently 'bad' for all investments or investors. While it signifies greater volatility, it can also be a characteristic of funds that pursue higher returns, such as small-cap or sectoral funds. For investors with a long investment horizon (e.g., 10+ years) and a high tolerance for risk, a fund with a higher standard deviation might align with their objective of aggressive wealth creation. The key is to ensure the higher risk is compensated by potentially higher returns and aligns with your personal risk appetite.
Does standard deviation predict future fund performance?
No, standard deviation is a historical measure and does not predict future fund performance. It merely indicates the degree of past price fluctuations. While it can provide insights into a fund's historical risk profile, it cannot guarantee that the fund will behave similarly in the future. Market conditions, fund manager changes, and economic factors can all alter a fund's future volatility. Investors should use it as an indicator of past consistency, not a crystal ball for future returns.
Is standard deviation the only risk metric I should consider?
No, standard deviation is a vital risk metric, but it should never be the only one considered. A comprehensive risk assessment requires evaluating a fund using multiple metrics such as Sharpe Ratio (risk-adjusted returns), Alpha (outperformance against benchmark), and Beta (market sensitivity). BullWiser's proprietary BullWiser Score integrates these and other factors to provide a holistic view of a fund's risk and return characteristics. Relying solely on standard deviation provides an incomplete picture of a fund's overall risk profile.
Frequently Asked Questions About Standard Deviation in Mutual Funds
How can I check the standard deviation of a mutual fund?
You can check a mutual fund's standard deviation on investment platforms like BullWiser's MF Analyser, fund house fact sheets, or financial data websites. It's usually listed alongside other risk metrics. This metric is readily available for most funds.
Does standard deviation change over time for a fund?
Yes, standard deviation is dynamic and changes over time as a fund's portfolio, market conditions, and historical returns evolve. It's a trailing indicator, reflecting past volatility. Therefore, it's important to review it periodically.
Is standard deviation relevant for debt mutual funds?
Absolutely, standard deviation is relevant for debt mutual funds too, though their volatility is typically lower than equity funds. It measures interest rate risk and credit risk impact on NAV stability. Even debt funds have fluctuations.
What is the relationship between standard deviation and the Sharpe Ratio?
The Sharpe Ratio uses standard deviation in its calculation to measure risk-adjusted returns. It assesses how much excess return a fund generates per unit of total risk (standard deviation). A higher Sharpe Ratio indicates better risk-adjusted performance. They are directly linked.
Can a fund with high standard deviation still be a good investment?
Yes, a fund with a high standard deviation can still be a good investment if it consistently delivers superior risk-adjusted returns over the long term, especially for investors with a high-risk tolerance and extended investment horizon. It depends on your individual goals and risk appetite.
Where can I find reliable data for mutual fund standard deviation in India?
Reliable data for mutual fund standard deviation in India can be found on the official AMFI website, individual fund house websites (in their fact sheets), or financial data aggregators like BullWiser.com. These sources provide comprehensive fund metrics. Always cross-reference data for accuracy.
Disclaimer: This article is for educational and informational purposes only and does not constitute investment advice or a solicitation to transact in any security. Mutual fund investments are subject to market risks. Past performance is not indicative of future returns. All regulatory data referenced is subject to change — verify current SEBI and AMFI guidelines on official sources. Consult a SEBI-registered investment adviser before making any financial decision.
For a complete list of SEBI-registered investment advisers, visit the official SEBI portal: SEBI Registered Investment Advisers.