What Is a Mutual Fund Factsheet and Why Is It Essential?
A mutual fund factsheet is a comprehensive monthly document published by Asset Management Companies (AMCs) that provides a snapshot of a mutual fund scheme's key characteristics, performance, and portfolio as of a specific date. This document is essential for investors as it consolidates critical data points, enabling a data-driven evaluation of a fund's suitability for their financial goals, aligning with AMFI's emphasis on transparency.
These factsheets serve as a primary source of verifiable information, covering everything from the fund's investment objective and scheme details to its expense structure, historical returns, risk metrics, and underlying asset allocation. By regularly reviewing factsheets, investors can track changes in fund management, portfolio strategy, and expense ratios, which are vital for ongoing portfolio hygiene and decision-making.
How to Navigate a Mutual Fund Factsheet: A Step-by-Step Guide
Navigating a mutual fund factsheet systematically allows investors to extract the most relevant information for their analysis, moving beyond superficial metrics to understand the fund's underlying mechanics. Each section provides unique insights into the fund's operational efficiency, risk profile, and potential for generating returns, consistent with SEBI's disclosure requirements.
-
Where do I find the fund's basic information?
Begin by locating the fund's foundational details, typically found at the top of the factsheet. Verify the fund name, its SEBI-mandated category (e.g., Large Cap, Flexi Cap, Debt Short Duration, as per SEBI circular SEBI/HO/IMD/DF3/CIR/P/2017/114 dated October 6, 2017), its benchmark index, and the Assets Under Management (AUM). The inception date helps gauge the fund's operational history, crucial for evaluating long-term performance.
-
How do I assess the fund's expense structure?
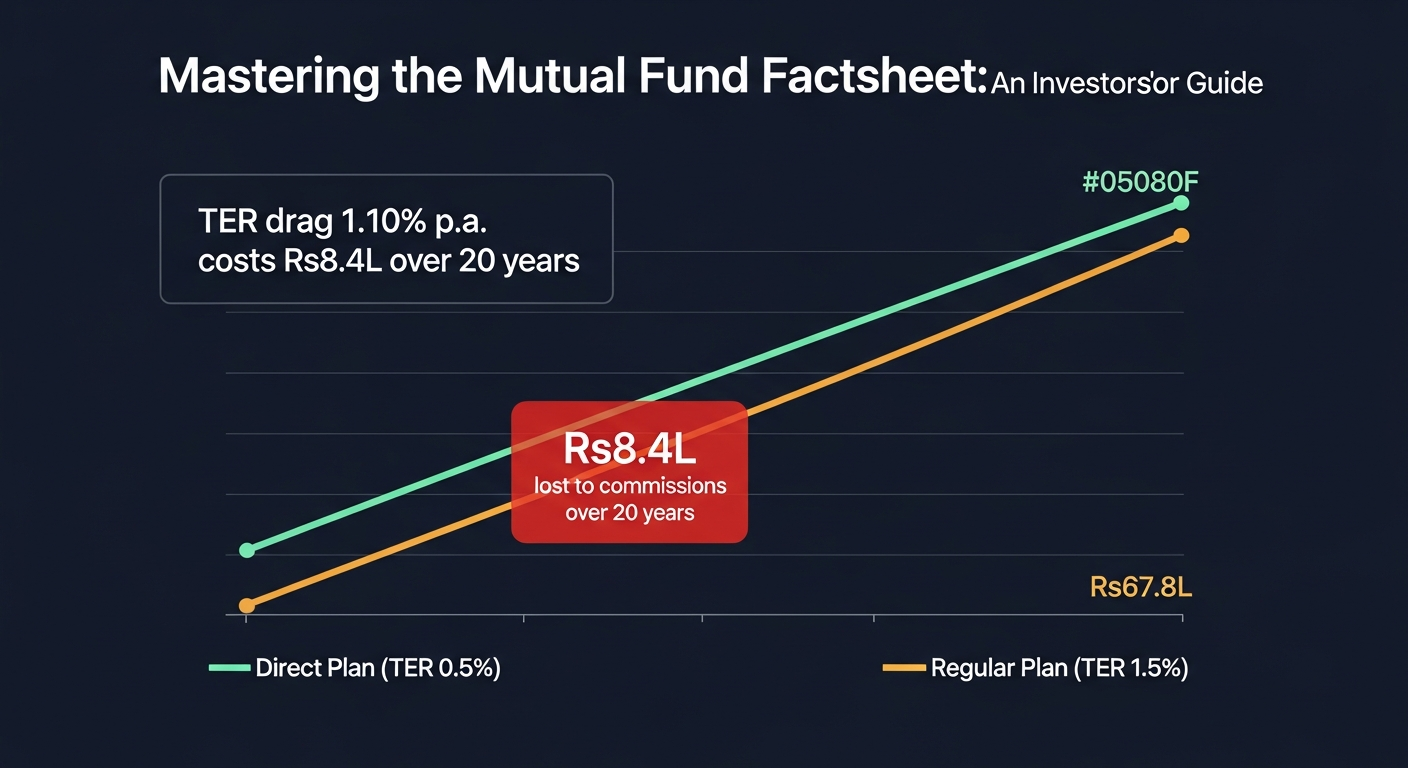
Scrutinise the Total Expense Ratio (TER), which represents the annual charges levied by the fund house as a percentage of the fund's average net assets. Compare the TER of the Direct Plan versus the Regular Plan; direct plans typically offer a 0.50-1.10% lower TER, per AMFI data, directly impacting your net returns over time. Also, note any exit loads, which are charges for redeeming units within a specified period, often 1% if redeemed within 1 year for equity funds.
-
What performance metrics should I look for?
Beyond simple CAGR, analyse performance across various time horizons (1-year, 3-year, 5-year, 10-year, Since Inception) and compare it against the fund's benchmark and category average. Crucially, evaluate risk-adjusted returns like the Sharpe Ratio (return per unit of risk), Alpha (excess return over benchmark), Beta (volatility relative to benchmark), and Standard Deviation (total volatility). These metrics provide a holistic view of the fund's efficiency in generating returns for the risk undertaken.
-
How can I understand the fund's portfolio composition?
Examine the fund's portfolio allocation section, which details its top 10 holdings, sectoral distribution, and market capitalisation exposure (large, mid, small cap). This reveals the fund's underlying strategy and potential concentration risks. For instance, a small cap fund should predominantly hold companies ranked 251 and below by market cap, as per SEBI classification rules.
-
What do fund manager details tell me?
Identify the fund manager(s) and their tenure with the scheme. A longer tenure often suggests continuity and a consistent investment philosophy. While past performance is not indicative of future results, understanding who is at the helm and for how long provides insight into the stability and experience guiding the fund's strategy.
-
Where can I find other important disclosures?
Look for details on Systematic Investment Plan (SIP) and Systematic Withdrawal Plan (SWP) options, minimum investment amounts, and any specific tax implications. For instance, Equity Linked Savings Schemes (ELSS) will highlight their 3-year lock-in period and Section 80C tax benefits up to Rs 1,50,000. These operational details are crucial for practical investment planning.
Deconstructing a Factsheet: A Worked Example with Parag Parikh Flexi Cap Fund
Let's illustrate how to apply these steps using a hypothetical factsheet for a prominent fund, the Parag Parikh Flexi Cap Fund - Direct Plan - Growth. While exact figures fluctuate daily, this example uses illustrative data points reflective of a typical factsheet as of early 2026 to demonstrate the analytical process.
Scenario: An investor is considering a monthly SIP of Rs 15,000 in Parag Parikh Flexi Cap Fund for 15 years, aiming for long-term capital appreciation. They want to understand the fund's profile and the impact of its TER.
Step 1: Basic Information Overview
A factsheet would show:
- Fund House: PPFAS Mutual Fund
- Category: Flexi Cap Fund (as per SEBI's categorization circular SEBI/HO/IMD/DF3/CIR/P/2017/114)
- Benchmark: Nifty 500 TRI
- AUM (Illustrative): Rs 65,000 Crores (as of January 2026)
- Inception Date: May 2013
This tells us it's a well-established fund with significant AUM, operating under the flexible mandate of a Flexi Cap category, which allows the fund manager to invest across large, mid, and small-cap companies without restrictions.
Step 2: Expense Structure Analysis
For the Parag Parikh Flexi Cap Fund - Direct Plan - Growth, a typical factsheet (as of January 2026) might show:
| Plan Type | Illustrative TER (%) | Annual Cost on Rs 10 Lakh Corpus |
|---|---|---|
| Direct Plan | 0.72% | Rs 7,200 |
| Regular Plan | 1.52% | Rs 15,200 |
The 0.80% differential (1.52% - 0.72%) highlights the significant cost saving of opting for the Direct Plan. Over a 15-year SIP of Rs 15,000/month (total investment Rs 27,00,000) with an assumed gross CAGR of 13% before TER, this difference compounds:
- Gross Corpus (before TER): Rs 78,90,000
- Net Corpus (Direct Plan, after 0.72% TER): Rs 72,50,000
- Net Corpus (Regular Plan, after 1.52% TER): Rs 66,70,000
The difference due to TER drag is approximately Rs 5,80,000 over 15 years, purely from the expense ratio differential. This demonstrates the power of choosing a lower TER.
Step 3: Performance and Risk Metrics
A factsheet would present performance against the benchmark and category. For instance:
| Time Period | Parag Parikh Flexi Cap (Direct Plan) (%) | Nifty 500 TRI Benchmark (%) | Flexi Cap Category Average (%) |
|---|---|---|---|
| 1 Year | 28.5% | 24.0% | 25.5% |
| 3 Years | 19.2% | 16.5% | 17.8% |
| 5 Years | 20.8% | 18.0% | 19.5% |
Additionally, risk metrics (illustrative as of January 2026):
| Risk Metric (3-Year) | Parag Parikh Flexi Cap | Flexi Cap Category Average |
|---|---|---|
| Standard Deviation | 12.5% | 14.0% |
| Beta | 0.85 | 0.95 |
| Sharpe Ratio | 1.20 | 1.05 |
| Alpha | 3.5% | 2.0% |
This shows consistent outperformance with lower volatility (lower Standard Deviation and Beta) and higher risk-adjusted returns (higher Sharpe and Alpha) compared to both its benchmark and category average, indicating efficient risk management.
Step 4: Portfolio Holdings Snapshot
A factsheet would list the top 10 holdings and sector allocation. For example (illustrative as of January 2026):
| Rank | Stock Name | Sector | % of Portfolio |
|---|---|---|---|
| 1 | HDFC Bank Ltd. | Financials | 8.2% |
| 2 | Infosys Ltd. | IT | 7.5% |
| 3 | Alphabet Inc. (Google) | Technology (Global) | 6.8% |
| 4 | Reliance Industries Ltd. | Oil & Gas / Diversified | 6.0% |
| 5 | Amazon.com Inc. | E-commerce (Global) | 5.5% |
| 6 | Axis Bank Ltd. | Financials | 4.8% |
| 7 | Tata Consultancy Services Ltd. | IT | 4.2% |
| 8 | Bajaj Holdings & Investment Ltd. | Financials | 3.9% |
| 9 | Microsoft Corp. | Technology (Global) | 3.7% |
| 10 | ITC Ltd. | FMCG | 3.5% |
This illustrates a diversified portfolio, including significant exposure to global tech giants and a healthy allocation to Indian financials and IT. The highest single stock holding is 8.2%, which is manageable and avoids excessive concentration risk.
Free · No spam · Unsubscribe anytime
Learn investing without the jargon
Plain-English guides on MFs, SIPs, and taxes — one email a week, free forever.
Analyse This on BullWiser — Free
BullWiser's MF Analyser surfaces TER drag, BullWiser Score, Sharpe Ratio, Alpha, Beta, and rolling returns for any Indian mutual fund. Compare funds side by side or upload your CAS statement to diagnose your full portfolio's weighted expense load and overlap.
Open BullWiser MF Analyser →Common Misconceptions About Mutual Fund Factsheets
Many investors approach mutual fund factsheets with preconceived notions that can lead to suboptimal decisions. Dispelling these myths with data and structural understanding is crucial for robust financial analysis.
Is the highest historical return always the best indicator?
No, the highest historical return alone is not the sole best indicator of a fund's quality. While attractive, raw returns do not account for the level of risk taken to achieve those returns. A fund with slightly lower returns but significantly lower volatility (as indicated by a lower Standard Deviation or higher Sharpe Ratio) might be a more efficient investment. Always cross-reference returns with risk-adjusted metrics; a fund delivering 20% CAGR with a 15% standard deviation might be less efficient than one delivering 18% CAGR with a 10% standard deviation, especially over the long term.
Does a low NAV mean a fund is cheap or has more growth potential?
This is a pervasive misconception. The Net Asset Value (NAV) of a mutual fund unit simply reflects the market value of the fund's assets minus its liabilities, divided by the number of outstanding units. A low NAV for a new fund or a fund that has split its units does not inherently mean it is 'cheap' or has greater growth potential than a fund with a high NAV. The growth potential is determined by the underlying portfolio's performance, not the absolute value of a single unit's NAV. Investing Rs 10,000 in a fund with NAV Rs 10 or Rs 100 will yield the same percentage return if the underlying portfolio grows by the same proportion.
Are all expense ratios the same across plans?
Absolutely not. One of the most critical distinctions often overlooked is the difference in Total Expense Ratios (TERs) between a fund's Direct Plan and its Regular Plan. As per SEBI circular SEBI/HO/IMD/DF2/CIR/P/2019/14 dated January 22, 2019, AMCs must disclose TERs for both plans separately. Regular plans include distributor commissions, making their TERs typically 0.50% to 1.10% higher than direct plans. This seemingly small percentage difference can amount to a substantial sum over a long investment horizon, as demonstrated in our worked example, directly eroding your net returns.
Frequently Asked Questions About Mutual Fund Factsheets
Is the information in a mutual fund factsheet always up-to-date?
Mutual fund factsheets are typically updated monthly by Asset Management Companies (AMCs), reflecting data as of the last business day of the previous month. While comprehensive, remember that market conditions and portfolio holdings can change rapidly. Always check the publication date.
What is the most important section to check in a factsheet?
The most important sections to check are the Total Expense Ratio (TER), performance history with risk-adjusted metrics like Sharpe Ratio, and the portfolio holdings. These three areas provide a robust overview of cost, return efficiency, and underlying investments. Understanding these metrics is key.
Can I find the direct plan expense ratio in a factsheet?
Yes, mutual fund factsheets clearly distinguish between the Total Expense Ratio (TER) for regular plans and direct plans. Direct plans consistently have a lower TER, often by 0.50% to 1.10% compared to regular plans, as they do not include distributor commissions. This difference is clearly visible.
How do I compare two funds using their factsheets?
To compare two funds using their factsheets, focus on comparing their TERs, risk-adjusted returns (Sharpe, Alpha), standard deviation, and portfolio allocation (sectoral and top holdings) against a common benchmark and their respective category averages over identical timeframes. This allows for a like-for-like analysis.
What does 'exit load' mean on a factsheet?
Exit load, as disclosed on a factsheet, is a charge levied by the fund house if you redeem your units before a specified period, typically one year for equity funds. For instance, a 1% exit load within 365 days means 1% of your redemption value is deducted. It acts as a disincentive for short-term redemptions.
Is a high AUM always better for a mutual fund?
A high Assets Under Management (AUM) indicates investor trust and scale but isn't always 'better' as it can sometimes limit a fund's agility, especially for small-cap funds. For large-cap funds, a larger AUM is generally manageable. It's one factor among many.
Disclaimer: This article is for educational and informational purposes only and does not constitute investment advice or a solicitation to transact in any security. Mutual fund investments are subject to market risks. Past performance is not indicative of future returns. All regulatory data referenced is subject to change — verify current SEBI and AMFI guidelines on official sources. Consult a SEBI-registered investment adviser before making any financial decision.
For a complete list of SEBI-registered investment advisers, visit the official SEBI portal: SEBI Registered Investment Advisers.