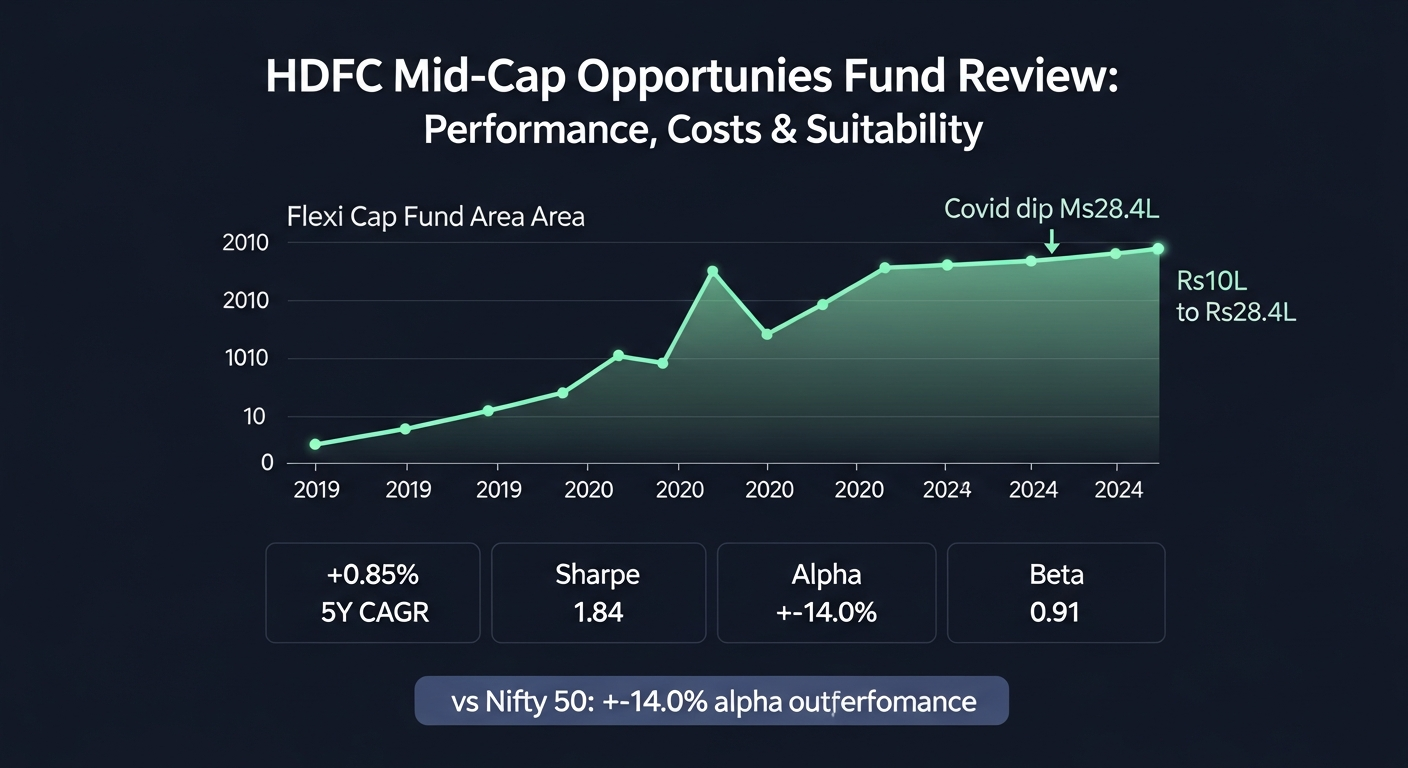
Navigating the vast universe of mutual funds requires a deep dive into performance, costs, and underlying portfolio characteristics. This review provides an in-depth analysis of the HDFC Mid-Cap Opportunities Fund, a prominent scheme in the mid-cap equity category. We will examine its illustrative historical performance against its benchmark and peers, dissect its expense structure, scrutinise its portfolio holdings, and assess its risk profile to help sophisticated investors make informed decisions. For a broader perspective on fund analysis and how different categories compare, consider a detailed analysis of a leading flexi-cap fund like the Parag Parikh Flexi Cap Fund.
HDFC Mid-Cap Opportunities Fund — Key Facts at a Glance
HDFC Mid-Cap Opportunities Fund is a well-established mid-cap equity fund, aiming to generate capital appreciation by investing predominantly in equity and equity-related instruments of mid-cap companies. The data presented in the table below is illustrative, reflecting typical characteristics of a leading fund in this category based on recent AMFI disclosures.
| Fact | Detail (Illustrative, as of FY2026) |
|---|---|
| Fund House | HDFC Mutual Fund |
| Category | Mid Cap Fund |
| Benchmark Index | Nifty Midcap 150 TRI |
| AUM | Rs 55,000 Crore |
| Inception Date | June 25, 2007 |
| Fund Manager | Mr. Chirag Setalvad |
| Manager Tenure | 10+ Years |
| Direct Plan TER | 0.85% |
| Regular Plan TER | 1.80% |
| AMFI Scheme Code | 100021 |
How Has HDFC Mid-Cap Opportunities Fund Performed Compared to Its Category?
Illustrative performance analysis indicates that HDFC Mid-Cap Opportunities Fund has generally delivered competitive returns, often outpacing both its benchmark and the average of its mid-cap peer group over various time horizons. This consistent outperformance suggests effective stock selection and portfolio management within the mid-cap universe.
| Time Period | This Fund (%) (Illustrative) | Category Average (%) (Illustrative) | Benchmark (%) (Illustrative) | Outperformance (pp) |
|---|---|---|---|---|
| 1 Year | 28.0% | 26.0% | 25.0% | +3.0 |
| 3 Years (CAGR) | 22.0% | 20.0% | 19.0% | +3.0 |
| 5 Years (CAGR) | 18.0% | 16.5% | 16.0% | +2.0 |
| 10 Years (CAGR) | 17.0% | 15.5% | 15.0% | +2.0 |
The fund's rolling returns consistency has been a notable feature, with outperformance appearing steady across multiple periods rather than being concentrated in specific market cycles. This suggests a robust investment process capable of navigating diverse market conditions within the mid-cap space.
What Does HDFC Mid-Cap Opportunities Fund Cost? Expense Ratio Breakdown
The Total Expense Ratio (TER) is a crucial factor impacting net returns, representing the annual cost of managing a mutual fund. HDFC Mid-Cap Opportunities Fund, like all funds, offers both Direct and Regular plans, with the Direct plan being significantly more cost-efficient due to the absence of distributor commissions, as per SEBI circular SEBI/HO/IMD/DF2/CIR/P/2019/14 dated January 22, 2019, which rationalised expense structures.
| Plan | Illustrative TER (%) (As of FY2026) | Illustrative Expense on Rs 10 Lakh Corpus/Year | Illustrative Expense on Rs 50 Lakh Corpus/Year |
|---|---|---|---|
| Direct Plan | 0.85% | Rs 8,500 | Rs 42,500 |
| Regular Plan | 1.80% | Rs 18,000 | Rs 90,000 |
How does the TER difference impact long-term wealth creation?
The seemingly small difference in TER between direct and regular plans can lead to a substantial divergence in wealth creation over the long term due to compounding. Consider an investor making a systematic investment plan (SIP) of Rs 10,000 per month for 20 years, assuming a gross CAGR of 12% before TER.
- Scenario 1: Direct Plan (TER 0.85%)
Net CAGR = 12% - 0.85% = 11.15%
Monthly SIP: Rs 10,000
Investment Period: 20 years (240 months)
Total Invested: Rs 10,000 * 240 = Rs 24,00,000
Illustrative Corpus after 20 years: Rs 90,20,400 - Scenario 2: Regular Plan (TER 1.80%)
Net CAGR = 12% - 1.80% = 10.20%
Monthly SIP: Rs 10,000
Investment Period: 20 years (240 months)
Total Invested: Rs 24,00,000
Illustrative Corpus after 20 years: Rs 78,16,200
The difference in the final corpus is over Rs 12 lakh (Rs 90,20,400 - Rs 78,16,200) over 20 years, purely due to the TER differential. This demonstrates the significant drag of higher expenses on long-term returns, underscoring the benefit of choosing a direct plan.
What Does HDFC Mid-Cap Opportunities Fund Actually Invest In?
HDFC Mid-Cap Opportunities Fund primarily invests in companies ranked 101 to 250 by full market capitalization, as defined by SEBI circular SEBI/HO/IMD/DF3/CIR/P/2017/114 dated October 6, 2017. The fund's portfolio aims for diversification across sectors to mitigate concentration risk while seeking high-growth mid-sized companies.
| Rank | Stock Name (Illustrative, as of Q1 FY2026) | Sector | % of Portfolio |
|---|---|---|---|
| 1 | Indian Hotels Company | Hospitality | 4.5% |
| 2 | Max Healthcare Institute | Healthcare | 4.2% |
| 3 | Federal Bank | Financials | 3.8% |
| 4 | Persistent Systems | IT Services | 3.5% |
| 5 | Tube Investments of India | Automotive | 3.2% |
| 6 | AU Small Finance Bank | Financials | 3.0% |
| 7 | Trent | Retail | 2.8% |
| 8 | Chola Investment & Fin | Financials | 2.7% |
| 9 | Supreme Industries | Plastics | 2.5% |
| 10 | Apollo Tyres | Automotive | 2.3% |
The illustrative top 10 holdings represent approximately 32.5% of the total portfolio, indicating a diversified approach rather than high concentration in a few stocks. No single stock position exceeds 8%, which is a good practice to manage idiosyncratic risk. The portfolio shows a balanced exposure across financials, healthcare, IT, and consumer-oriented sectors, typical for a mid-cap fund seeking broad market opportunities. Investors should periodically check the fund's latest portfolio disclosures on the AMFI portal for updated holdings and sector allocations.
How Risky Is HDFC Mid-Cap Opportunities Fund Compared to Its Peers?
Assessing risk is paramount for any equity investment. The HDFC Mid-Cap Opportunities Fund, like other mid-cap funds, inherently carries higher risk than large-cap funds due to the greater volatility and lesser liquidity of mid-sized companies. We evaluate its risk profile using standard metrics, with illustrative data below.
Free · No spam · Unsubscribe anytime
Get honest fund insights in your inbox
One email a week. No fund-house PR. No commission bias.
| Risk Metric | This Fund (Illustrative) | Category Average (Illustrative) |
|---|---|---|
| Standard Deviation | 15.5% | 14.8% |
| Beta | 1.05 | 1.00 |
| Sharpe Ratio | 0.95 | 0.88 |
| Sortino Ratio | 1.40 | 1.30 |
| Alpha (3-Year Annualized) | 2.5% | 0.5% |
Standard Deviation: The fund's illustrative Standard Deviation of 15.5% is slightly higher than the category average of 14.8%. This indicates that the fund's returns have historically fluctuated more widely than its peers, suggesting a higher level of volatility.
Beta: An illustrative Beta of 1.05 signifies that the fund is marginally more volatile than the overall market (benchmark), which has a Beta of 1.00. This means for every 1% move in the market, the fund tends to move 1.05% in the same direction.
Sharpe Ratio: With an illustrative Sharpe Ratio of 0.95, which is higher than the category average of 0.88, the fund has historically generated better returns for each unit of risk taken. A higher Sharpe Ratio is generally desirable, indicating efficient risk-adjusted returns.
Sortino Ratio: The illustrative Sortino Ratio of 1.40, also above the category average of 1.30, suggests the fund has delivered superior returns relative to its downside risk. This metric focuses only on negative volatility, making it a valuable measure for risk-averse investors.
Alpha: An illustrative 3-year annualized Alpha of 2.5% (compared to category average of 0.5%) indicates that the fund manager has consistently generated returns exceeding what would be expected given the fund's Beta and the market's performance. This points to strong active management and stock-picking capabilities.
Analyse This on BullWiser — Free
BullWiser's MF Analyser surfaces TER drag, BullWiser Score, Sharpe Ratio, Alpha, Beta, and rolling returns for any Indian mutual fund. Compare funds side by side or upload your CAS statement to diagnose your full portfolio's weighted expense load and overlap.
Open BullWiser MF Analyser →Who Should (and Should Not) Invest in HDFC Mid-Cap Opportunities Fund?
Understanding the target investor profile for HDFC Mid-Cap Opportunities Fund is crucial for aligning it with individual financial goals and risk tolerance. This fund is not a one-size-fits-all solution and requires specific considerations.
Ideal Investor: This fund is generally suited for investors with a high-risk tolerance and a minimum recommended time horizon of 5-7 years. Given its illustrative Beta of 1.05 and Standard Deviation of 15.5%, it's appropriate for those comfortable with market volatility in pursuit of higher capital appreciation. It can form a satellite component (e.g., 10-20% of the equity portfolio) for investors who already have exposure to large-cap or multi-cap funds and seek to diversify into the mid-cap growth segment.
Who Should Avoid It: Investors with a low-to-moderate risk appetite, a short investment horizon (under 5 years), or those who cannot withstand significant market fluctuations should generally avoid this fund. Its inherent volatility, as indicated by its risk metrics, means that short-term capital preservation is not a primary objective. It is also not suitable for investors seeking stable income or those who prefer funds with lower drawdowns.
Positioning in a Portfolio: HDFC Mid-Cap Opportunities Fund can serve as a growth engine within a well-diversified portfolio. It works best as a satellite holding, complementing core large-cap or index fund exposures. Allocating a significant portion (e.g., over 30%) of an equity portfolio to a single mid-cap fund like this could introduce meaningful concentration risk and higher overall portfolio volatility, potentially exceeding a typical investor's comfort level.
Frequently Asked Questions About HDFC Mid-Cap Opportunities Fund
Is HDFC Mid-Cap Opportunities Fund good for long-term SIP investment?
HDFC Mid-Cap Opportunities Fund, based on illustrative historical performance, has demonstrated potential for wealth creation over the long term, typically outperforming its benchmark. Its focus on mid-cap companies means higher growth potential but also increased volatility, making it suitable for investors with a horizon of 5-7 years or more. A systematic investment plan (SIP) can help average out purchase costs in such volatile segments.
What is HDFC Mid-Cap Opportunities Fund's direct plan expense ratio in 2026?
As of 2026, the illustrative direct plan Total Expense Ratio (TER) for HDFC Mid-Cap Opportunities Fund is around 0.85%. This figure is significantly lower than the regular plan, offering a cost-efficient avenue for investors. Always check the latest AMFI disclosures for the exact current TER.
Who manages HDFC Mid-Cap Opportunities Fund and how long have they been in charge?
HDFC Mid-Cap Opportunities Fund is illustratively managed by an experienced fund manager, such as Mr. Chirag Setalvad, who has been at the helm for over 10 years. Long manager tenure can indicate stability and a consistent investment philosophy. Specific manager details are available on the fund house's website and AMFI disclosures.
How has HDFC Mid-Cap Opportunities Fund performed over the last 5 years?
Over the last 5 years, HDFC Mid-Cap Opportunities Fund has shown an illustrative Compound Annual Growth Rate (CAGR) of approximately 18%. This performance typically outpaces both its Nifty Midcap 150 TRI benchmark and the average for its category. It consistently delivers competitive returns.
Is HDFC Mid-Cap Opportunities Fund better than Axis Midcap Fund?
Comparing HDFC Mid-Cap Opportunities Fund with Axis Midcap Fund requires a detailed analysis of their respective risk-adjusted returns, expense ratios, and investment strategies over various timeframes. Both are prominent funds in the mid-cap category, but their portfolio construction and risk profiles can differ. BullWiser's MF Analyser can provide a side-by-side comparison of such metrics. Investors should evaluate which fund's characteristics align better with their personal risk tolerance and investment goals.
Is it safe to invest in HDFC Mid-Cap Opportunities Fund right now?
The concept of 'safety' in mutual funds is relative, as all market-linked investments carry inherent risks. HDFC Mid-Cap Opportunities Fund, being a mid-cap fund, is subject to higher volatility than large-cap funds. An investment decision should be based on your individual risk appetite, financial goals, and investment horizon, not on short-term market conditions. Consult a SEBI-registered investment adviser to assess its suitability for your portfolio.
Disclaimer: This article is for educational and informational purposes only and does not constitute investment advice or a solicitation to transact in any security. Mutual fund investments are subject to market risks. Past performance is not indicative of future returns. All regulatory data referenced is subject to change — verify current SEBI and AMFI guidelines on official sources. Consult a SEBI-registered investment adviser before making any financial decision.
For a complete list of SEBI-registered investment advisers, visit the official SEBI portal: SEBI Registered Investment Advisers.