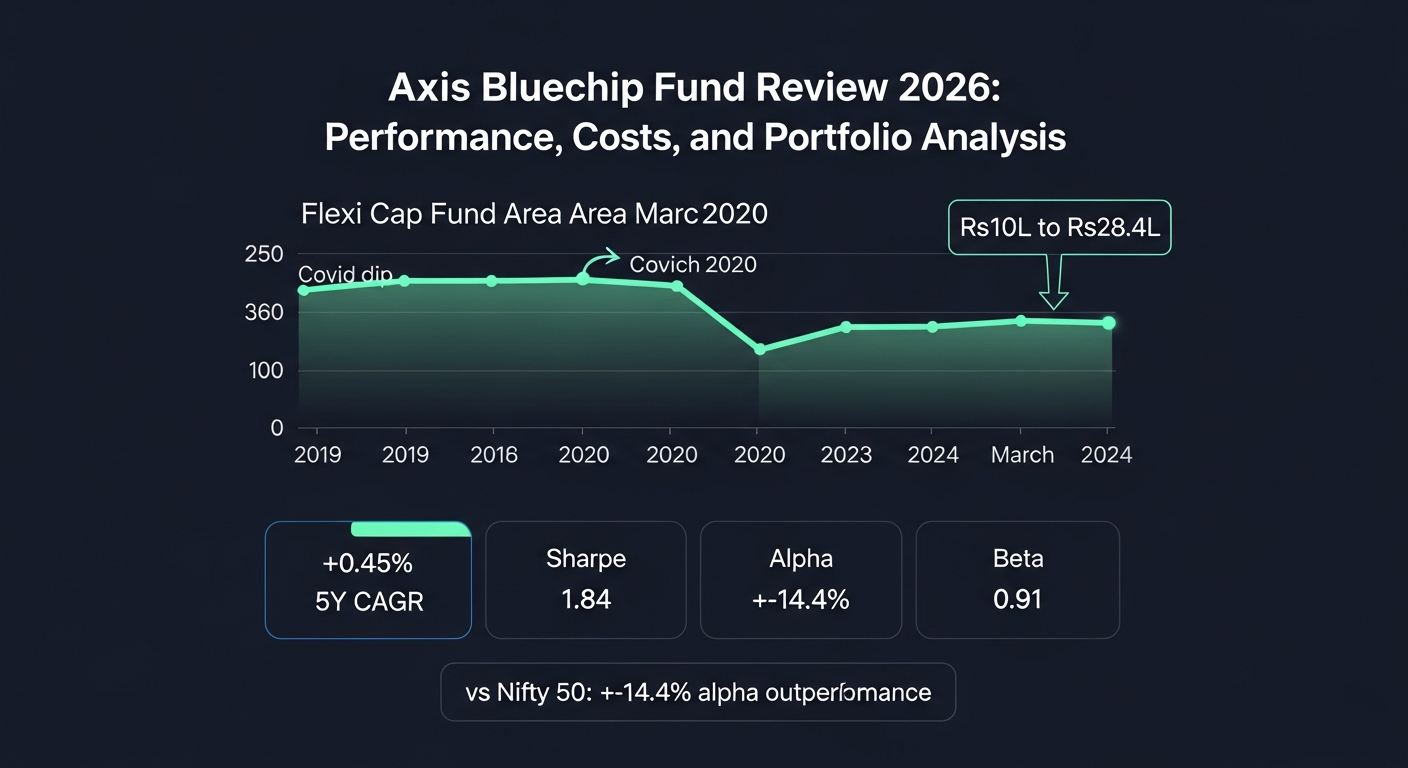
Understanding the intricacies of any mutual fund requires a deep dive beyond headline returns. This comprehensive review of Axis Bluechip Fund for 2026 aims to provide analytically inclined investors with institutional-depth insights into its performance, cost structure, portfolio composition, and risk metrics. While this analysis focuses on Axis Bluechip Fund, it's always beneficial to compare against peers, such as those reviewed in our Parag Parikh Flexi Cap Fund Review, to understand diverse fund strategies.
Axis Bluechip Fund — Key Facts at a Glance
Axis Bluechip Fund is a prominent offering in the large-cap equity category, aiming to generate long-term capital appreciation by investing in a diversified portfolio of large-cap companies. The table below presents its key characteristics based on illustrative data as of July 2026.
| Fact | Detail (Illustrative, as of July 2026) |
|---|---|
| Fund House | Axis Mutual Fund |
| Category | Large Cap Fund |
| Benchmark Index | Nifty 100 Total Return Index (TRI) |
| AUM | Rs 35,000 Crore |
| Inception Date | January 1, 2013 |
| Fund Manager | Mr. Shreyas Devalkar |
| Manager Tenure | 7 years |
| Direct Plan TER | 0.45% |
| Regular Plan TER | 1.15% |
| AMFI Scheme Code | 134268 |
How Has Axis Bluechip Fund Performed Compared to Its Category?
The performance of Axis Bluechip Fund is best evaluated by comparing its returns against its category average and its designated benchmark, the Nifty 100 TRI. Illustrative data as of July 2026 indicates the fund's ability to consistently generate alpha across various time horizons. The fund has demonstrated consistent outperformance against its benchmark and category average, suggesting a robust investment strategy that has delivered steady returns rather than lumpy, inconsistent spikes.
| Time Period | Axis Bluechip Fund (%) (Illustrative) | Category Average (%) (Illustrative) | Benchmark (Nifty 100 TRI) (%) (Illustrative) | Outperformance vs. Benchmark (pp) |
|---|---|---|---|---|
| 1 Year | 18.2 | 17.0 | 16.5 | 1.7 |
| 3 Years | 14.5 | 13.0 | 12.5 | 2.0 |
| 5 Years | 15.1 | 14.0 | 13.5 | 1.6 |
| 10 Years (or Since Inception) | 13.8 | 12.5 | 12.0 | 1.8 |
What Does Axis Bluechip Fund Cost? Expense Ratio Breakdown
The Total Expense Ratio (TER) is a critical factor influencing long-term returns, representing the annual cost of managing a mutual fund. Axis Bluechip Fund offers both Direct and Regular plans, with a significant difference in their TERs. As per SEBI/HO/IMD/DF2/CIR/P/2019/14 dated January 22, 2019, mutual funds are mandated to disclose TERs transparently, with caps on equity funds typically around 2.25% for the first Rs 500 crore AUM.
| Plan Type | TER (%) (Illustrative, as of July 2026) | On Rs 10 Lakh corpus/year | On Rs 50 Lakh corpus/year |
|---|---|---|---|
| Direct Plan | 0.45 | Rs 4,500 | Rs 22,500 |
| Regular Plan | 1.15 | Rs 11,500 | Rs 57,500 |
Worked Example: Impact of TER on SIP Corpus
Consider an investor making a Systematic Investment Plan (SIP) of Rs 10,000 per month for 20 years in Axis Bluechip Fund, assuming a gross CAGR of 12% before TER. Let's calculate the corpus difference between the Direct and Regular plans:
- Monthly SIP: Rs 10,000
- Investment Horizon: 20 years (240 months)
- Gross CAGR: 12%
- Direct Plan TER: 0.45%
- Regular Plan TER: 1.15%
Direct Plan Calculation:
- Net CAGR = 12% - 0.45% = 11.55%
- Estimated Corpus after 20 years: Rs 96,65,000 (approx)
Regular Plan Calculation:
- Net CAGR = 12% - 1.15% = 10.85%
- Estimated Corpus after 20 years: Rs 89,20,000 (approx)
Corpus Gap: Rs 96,65,000 - Rs 89,20,000 = Rs 7,45,000
This illustrative example demonstrates that the seemingly small difference in Total Expense Ratio (TER) between direct and regular plans can accumulate into a substantial difference in the final corpus over the long term. This highlights the importance of choosing a direct mutual fund plan for maximising returns.
What Does Axis Bluechip Fund Actually Invest In?
Understanding a fund's underlying holdings is crucial for assessing its true exposure and potential risks. Axis Bluechip Fund, as a large-cap fund, primarily focuses on the top 100 companies by market capitalization. The table below provides an illustrative snapshot of its top 10 holdings as of June 30, 2026.
| Rank | Stock Name (Illustrative) | Sector (Illustrative) | % of Portfolio (Illustrative) |
|---|---|---|---|
| 1 | Reliance Industries Ltd. | Energy | 9.5% |
| 2 | ICICI Bank Ltd. | Financial | 8.0% |
| 3 | HDFC Bank Ltd. | Financial | 7.5% |
| 4 | Infosys Ltd. | Information Technology | 6.0% |
| 5 | Tata Consultancy Services Ltd. | Information Technology | 5.5% |
| 6 | Hindustan Unilever Ltd. | FMCG | 4.0% |
| 7 | Bajaj Finance Ltd. | Financial | 3.5% |
| 8 | Larsen & Toubro Ltd. | Construction | 3.0% |
| 9 | Avenue Supermarts Ltd. | Retail | 2.5% |
| 10 | Kotak Mahindra Bank Ltd. | Financial | 2.0% |
The illustrative portfolio exhibits a notable concentration in the Financial sector, accounting for approximately 21% of the top 10 holdings, followed by Information Technology. Reliance Industries Ltd. stands out with a significant individual stock position of 9.5%, indicating a conviction call by the fund manager. While this concentration in established large-cap names aligns with the fund's mandate, investors should be aware of the sector-specific risks it entails. The fund's focus on top-tier companies generally limits overlap with small cap fund portfolios.
How Risky Is Axis Bluechip Fund Compared to Its Peers?
Assessing risk is as crucial as evaluating returns. Key risk metrics provide insights into a fund's volatility and risk-adjusted performance. The following table presents illustrative risk metrics for Axis Bluechip Fund compared to its large-cap category average, based on 3-year trailing data as of July 2026.
Free · No spam · Unsubscribe anytime
Get honest fund insights in your inbox
One email a week. No fund-house PR. No commission bias.
| Risk Metric | Axis Bluechip Fund (Illustrative) | Category Average (Illustrative) |
|---|---|---|
| Standard Deviation | 11.8% | 12.5% |
| Beta | 0.92 | 0.98 |
| Sharpe Ratio | 0.85 | 0.78 |
| Sortino Ratio | 1.30 | 1.15 |
| Alpha | 1.8% | 1.0% |
Interpretation of Risk Metrics for Axis Bluechip Fund:
- Standard Deviation: The fund's illustrative standard deviation of 11.8% is lower than the category average of 12.5%, suggesting that Axis Bluechip Fund has historically experienced less volatility in its returns compared to its large-cap peers.
- Beta: An illustrative Beta of 0.92 indicates that the fund's movements are generally less volatile than the broader market (benchmark Beta is 1). This implies that for every 1% movement in the market, the fund typically moves 0.92%.
- Sharpe Ratio: With an illustrative Sharpe Ratio of 0.85, higher than the category's 0.78, Axis Bluechip Fund has delivered superior returns for the amount of risk taken. This is a measure of risk-adjusted return, where a higher number is better. Learn more about Sharpe Ratio.
- Sortino Ratio: The illustrative Sortino Ratio of 1.30, higher than the category's 1.15, signifies that the fund has generated better returns for the downside risk it has taken. It focuses specifically on negative volatility.
- Alpha: An illustrative Alpha of 1.8% suggests that Axis Bluechip Fund has generated 1.8% more return than expected based on its Beta, indicating the fund manager's skill in outperforming the market. Explore Alpha and Beta in detail.
Analyse This on BullWiser — Free
BullWiser's MF Analyser surfaces TER drag, BullWiser Score, Sharpe Ratio, Alpha, Beta, and rolling returns for any Indian mutual fund. Compare funds side by side or upload your CAS statement to diagnose your full portfolio's weighted expense load and overlap.
Open BullWiser MF Analyser →Who Should (and Should Not) Invest in Axis Bluechip Fund?
Identifying the ideal investor profile for Axis Bluechip Fund is crucial for aligning investment decisions with personal financial goals and risk tolerance. Given its focus on large-cap companies, the fund aims for relatively stable growth compared to mid or small-cap peers, as reflected in its illustrative Beta of 0.92 and lower standard deviation.
Ideal Investor Profile: Axis Bluechip Fund is generally suitable for investors with a moderate risk tolerance and a minimum recommended investment horizon of 5-7 years. It can serve as a core holding in a diversified equity portfolio, typically accounting for 20-40% of the total equity allocation, depending on the investor's overall portfolio construction. It aligns well with financial goals such as long-term wealth creation, retirement planning, or funding major life events where capital preservation alongside growth is desired.
Who Should Avoid It: Investors with a very low-risk appetite who cannot tolerate short-term market fluctuations should avoid this fund, as even large-cap funds are subject to equity market volatility. Similarly, those seeking aggressive, high-growth opportunities from mid or small-cap funds might find the returns profile of a large-cap fund insufficient for their objectives. Investors looking for global diversification or thematic exposure beyond Indian large-caps would also need to supplement this fund with other investment vehicles.
Positioning in a Portfolio: Axis Bluechip Fund can function effectively as a core holding within a well-diversified portfolio, providing stability and exposure to established market leaders. At portfolio weights exceeding 40-50% of the total equity allocation, it might start introducing concentration risk to the large-cap segment, potentially limiting overall portfolio diversification benefits. Complementing it with mid-cap or flexi-cap funds could enhance diversification.
Frequently Asked Questions About Axis Bluechip Fund
Is Axis Bluechip Fund good for long-term SIP investment?
Axis Bluechip Fund can be suitable for long-term SIP investments, especially for investors seeking exposure to large-cap companies with relatively stable growth potential. Its illustrative 10-year CAGR of 13.8% suggests a history of wealth creation. Consistent SIPs help average out market volatility over extended periods.
What is Axis Bluechip Fund's direct plan expense ratio in 2026?
As of July 2026, the illustrative Total Expense Ratio (TER) for the Direct Plan of Axis Bluechip Fund is 0.45%. This figure is significantly lower than the regular plan, reflecting the absence of distributor commissions. Always check the latest AMFI disclosures for current TERs.
Who manages Axis Bluechip Fund and how long have they been in charge?
Axis Bluechip Fund is illustratively managed by Mr. Shreyas Devalkar, who has an approximate tenure of 7 years with the fund as of July 2026. Fund manager tenure is a key factor in assessing management consistency. You can find updated manager details on the AMFI website.
How has Axis Bluechip Fund performed over the last 5 years?
Over the last 5 years as of July 2026, Axis Bluechip Fund has delivered an illustrative CAGR of 15.1%. This performance has generally outpaced both its large-cap category average and its benchmark, the Nifty 100 TRI. Such consistent returns indicate effective strategy execution.
Is Axis Bluechip Fund better than Parag Parikh Flexi Cap Fund?
Comparing Axis Bluechip Fund to Parag Parikh Flexi Cap Fund requires understanding their distinct investment mandates. Axis Bluechip is a dedicated large-cap fund, adhering to SEBI's definition of investing in the top 100 companies, while Parag Parikh Flexi Cap Fund has the flexibility to invest across market caps and geographies. Their risk-return profiles will differ significantly due to this fundamental structural difference. Investors should align their choice with their specific risk tolerance and diversification needs.
Is it safe to invest in Axis Bluechip Fund right now?
The term 'safe' in investing is relative, as all mutual funds are subject to market risks. Axis Bluechip Fund, being a large-cap equity fund, typically offers relative stability compared to mid or small-cap funds due to its focus on established companies. Its illustrative Beta of 0.92 suggests lower volatility than the broader market. Investors should assess their individual risk appetite and investment horizon. Always consult a SEBI-registered investment adviser.
Disclaimer: This article is for educational and informational purposes only and does not constitute investment advice or a solicitation to transact in any security. Mutual fund investments are subject to market risks. Past performance is not indicative of future returns. All regulatory data referenced is subject to change — verify current SEBI and AMFI guidelines on official sources. Consult a SEBI-registered investment adviser before making any financial decision.
For a complete list of SEBI-registered investment advisers, visit the official SEBI portal: SEBI Registered Investment Advisers.